Overview
Supported Trace Formats
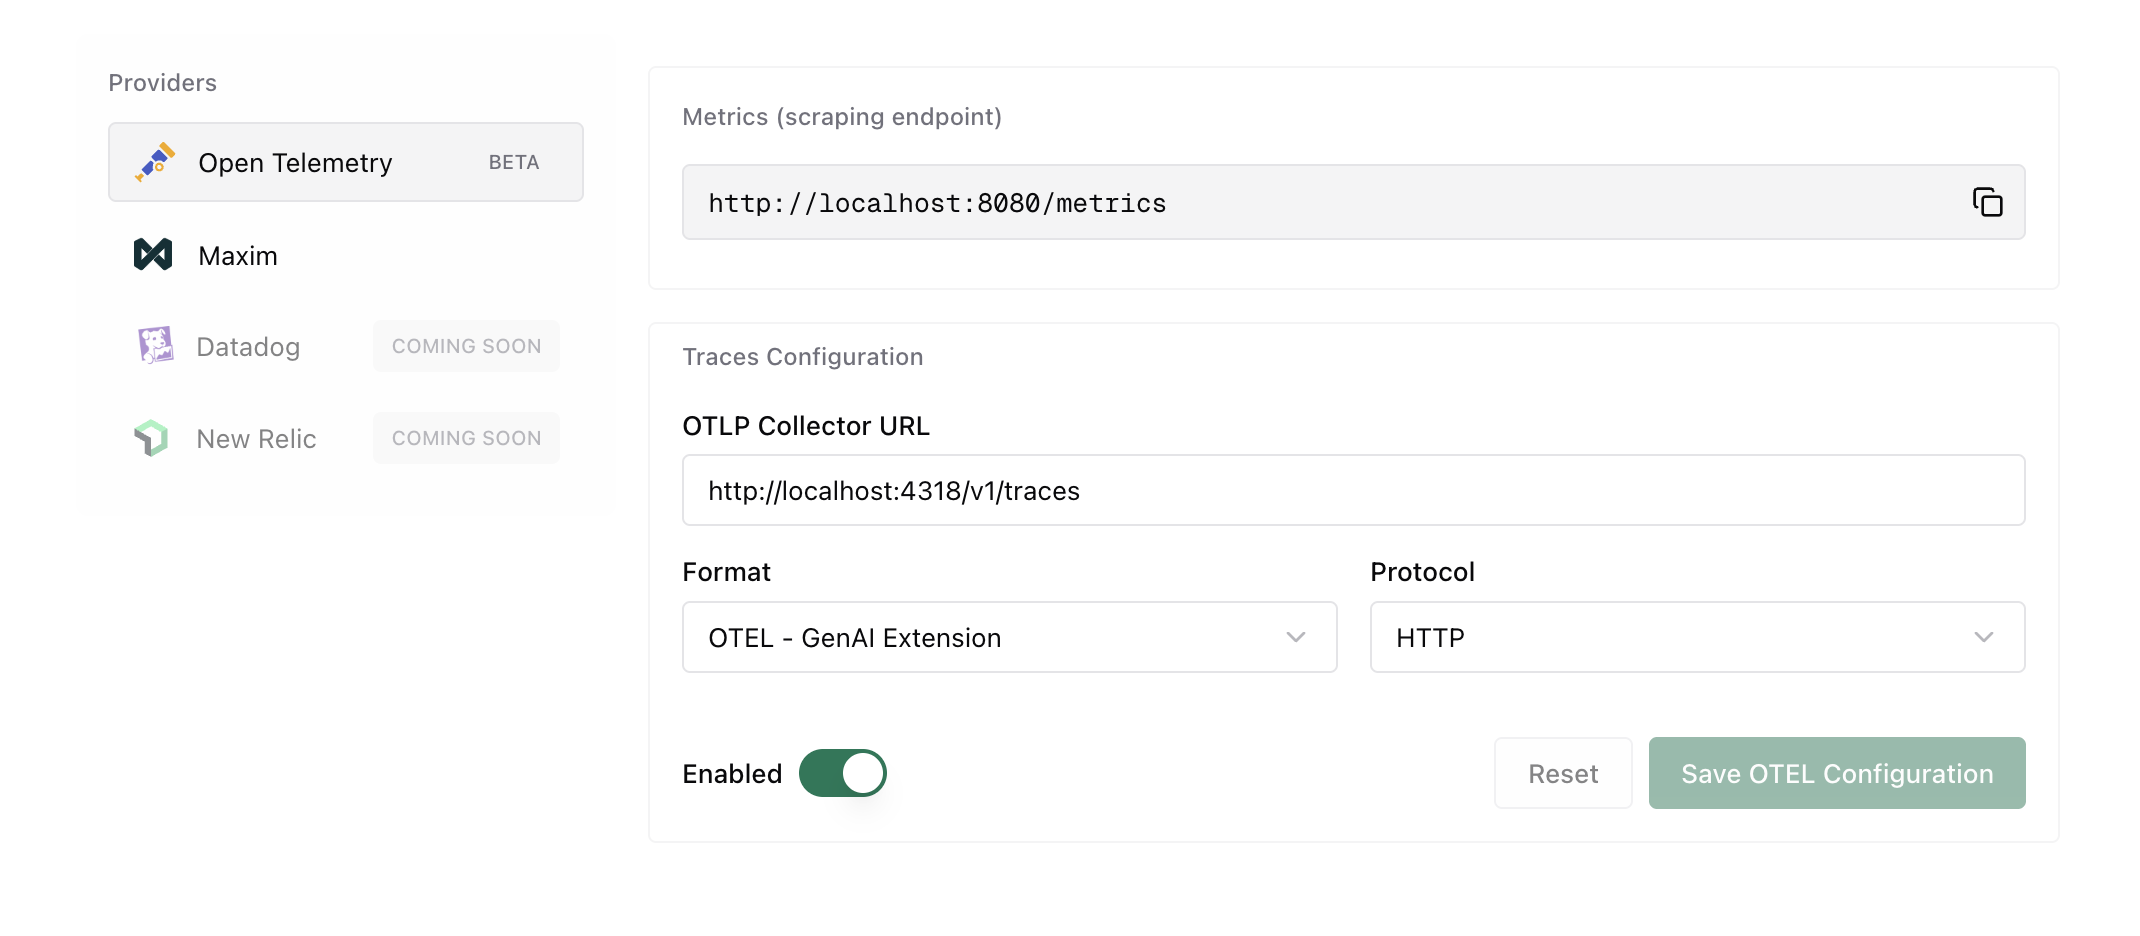
The plugin supports multiple trace formats to match your observability platform:Configuration
Required Fields
Environment Variable Substitution
collector_url, metrics_endpoint, and individual header values all support the env. prefix to read from environment variables at runtime. This keeps sensitive URLs and credentials out of stored configuration.
Resource Attributes
The plugin supports the standardOTEL_RESOURCE_ATTRIBUTES environment variable. Any attributes defined in this variable will be automatically attached to every span emitted by the plugin.
- Environment identification - Distinguish between production, staging, and development traces
- Service versioning - Track which version of your service generated the trace
- Team attribution - Tag traces with team ownership for filtering and alerting
- Custom metadata - Add any key-value pairs relevant to your observability needs
Session Tracking
Whenever a request carries thex-bf-session-id header, Bifrost tags the trace’s root span with the OTEL-conventional session.id attribute. This happens regardless of the group_traces_by_session setting, so you can always filter and correlate traces by session in your backend even when each request remains its own trace.
Grouping Traces by Session
By default, each request Bifrost handles becomes its own OTEL trace (still tagged withsession.id as described above). Enable group_traces_by_session to instead group every request that carries the same x-bf-session-id header into a single trace, with each request’s root span appearing as a top-level sibling under that trace. This is useful for viewing a multi-turn conversation or agent run as one trace in your backend.
An inbound W3C
traceparent always takes precedence: a request that arrives on a distributed trace stays on that trace and is not regrouped by session. Session grouping only applies to requests that have a session ID but no incoming trace context.Because all requests in a session share one trace, very long-lived sessions produce large traces. Use a session scope that matches how you want to view activity in your backend.x-bf-session-id header on each request you want grouped together.
Setup
- UI
- Go SDK
- config.json
- config.json (v1.5.8+)
Quick Start with Docker
Get started quickly with a complete observability stack using the included Docker Compose configuration:- OTel Collector - Receives traces on ports 4317 (gRPC) and 4318 (HTTP)
- Tempo - Distributed tracing backend
- Prometheus - Metrics collection
- Grafana - Visualization dashboard
http://localhost:3000 (default credentials: admin/admin)
Popular Platform Integrations
- Grafana Cloud
- Datadog
- New Relic
- Honeycomb
- Langfuse
- Self-Hosted
Captured Data
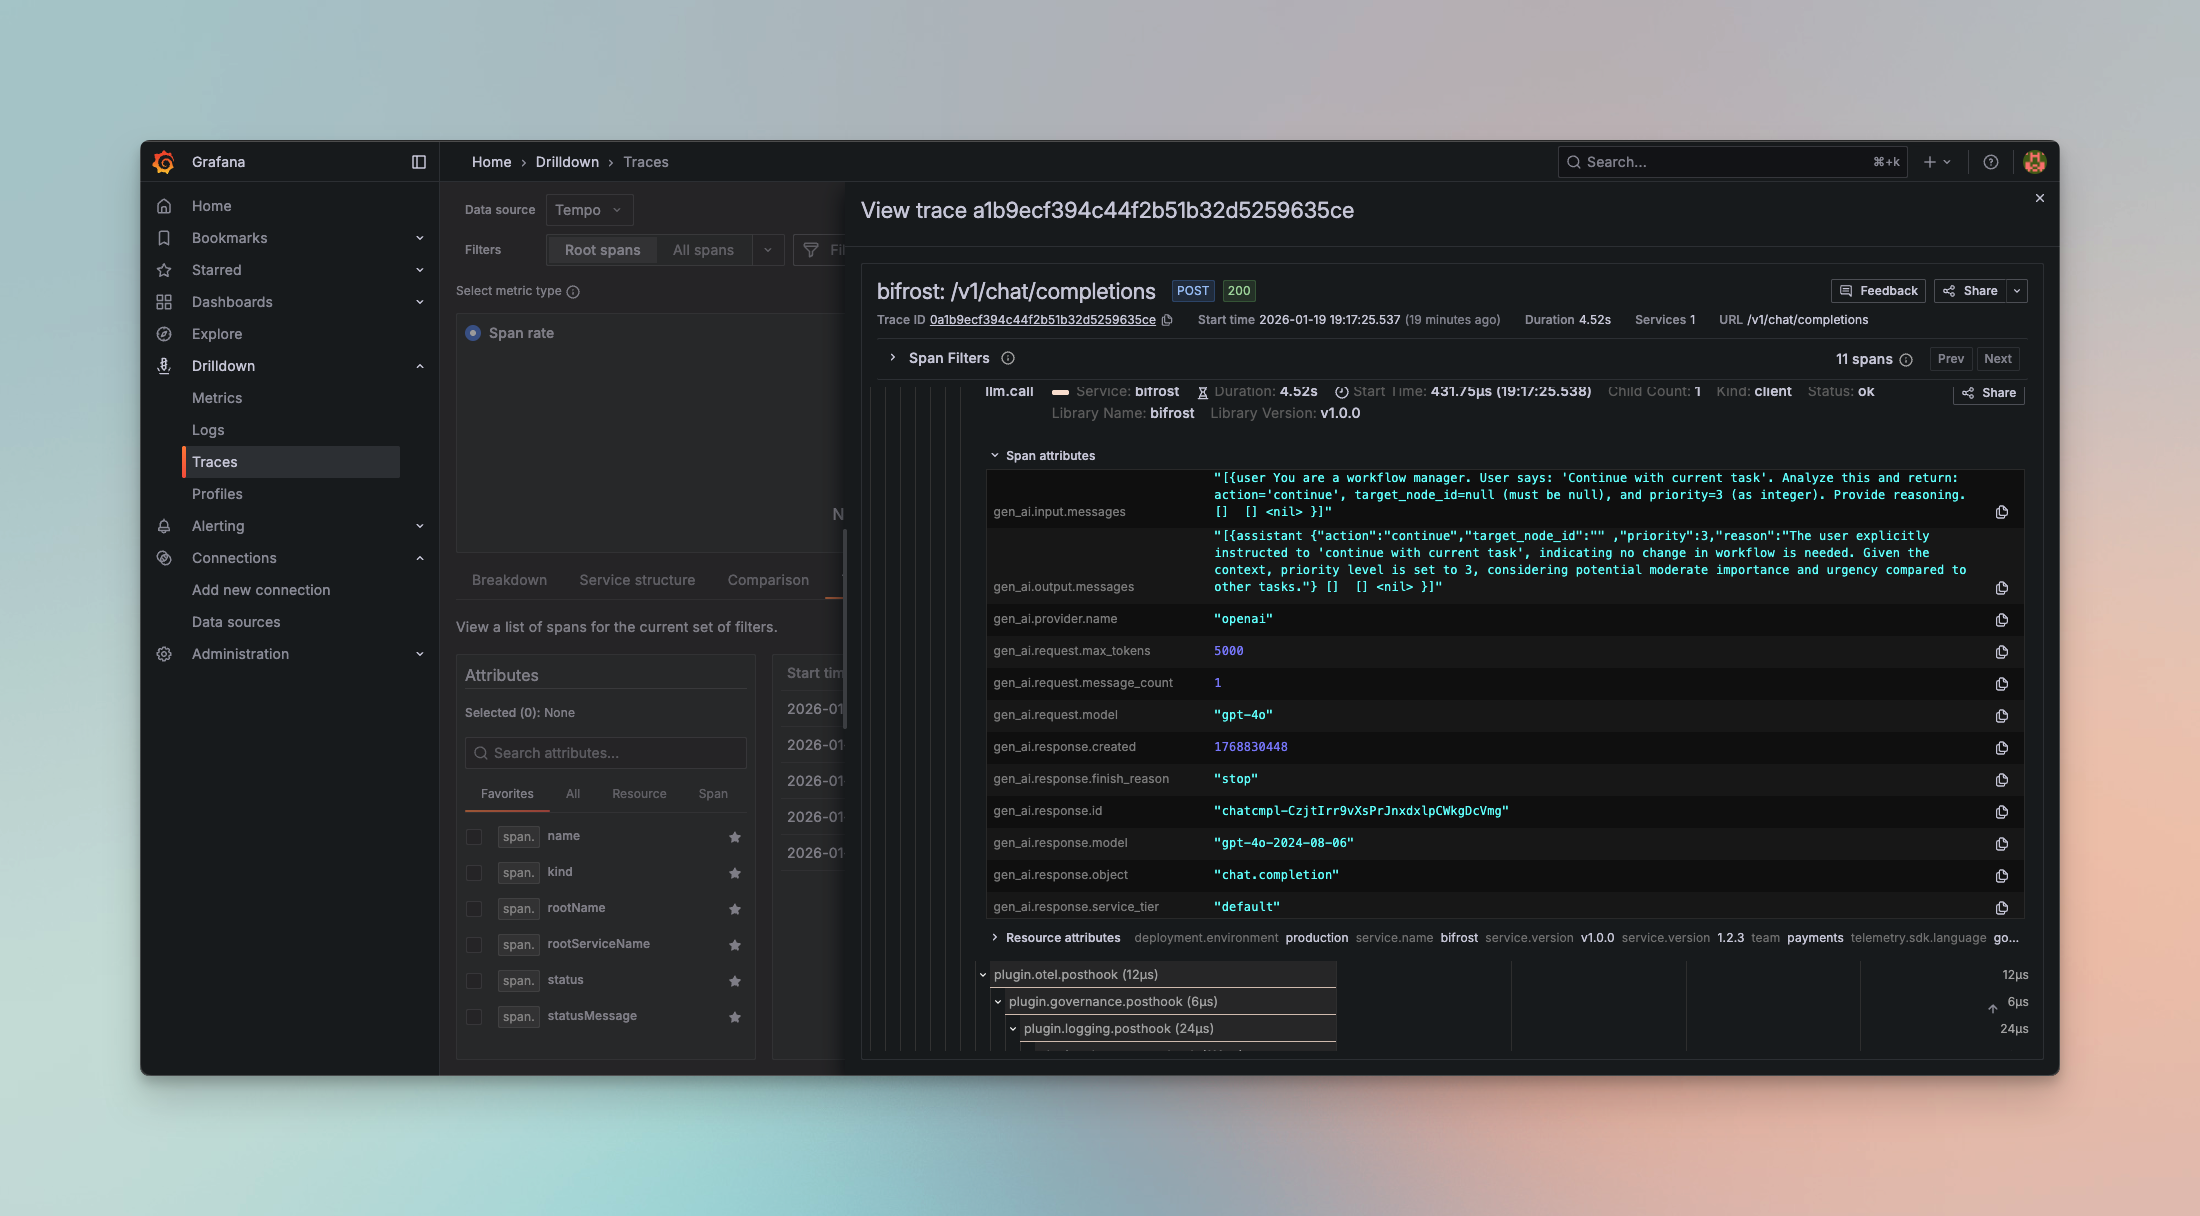
Each trace includes comprehensive LLM operation metadata following OpenTelemetry semantic conventions:Span Attributes
- Span Name: Based on request type (
gen_ai.chat,gen_ai.text,gen_ai.embedding, etc.) - Service Info:
service.name=bifrost,service.version - Provider & Model:
gen_ai.provider.name,gen_ai.request.model - Session:
session.idon the root span when the request carries anx-bf-session-idheader (see Session Tracking)
Request Parameters
- Temperature, max_tokens, top_p, stop sequences
- Presence/frequency penalties
- Tool configurations and parallel tool calls
- Custom parameters via
ExtraParams
Input/Output Data
- Complete chat history with role-based messages
- Prompt text for completions
- Response content with role attribution
- Tool calls and results
Performance Metrics
- Token usage (prompt, completion, total)
- Cost calculations in dollars
- Latency and timing (start/end timestamps)
- Error details with status codes
Caller-Supplied Headers
Headers Bifrost forwards to the upstream provider — bothx-bf-eh-* prefixed headers and headers matched by the direct allowlist — are also surfaced on the llm.call span as gen_ai.request.extra_header.<name> attributes. This makes it easy to filter or correlate traces by caller context (session ID, tenant ID, correlation IDs) without standing up extra plumbing.
For example, sending x-bf-eh-session-id: sess-abc-123 produces the span attribute gen_ai.request.extra_header.session-id = "sess-abc-123". See Extra Headers for the full request format.
Example Span
Supported Request Types
The OTel plugin captures all Bifrost request types:- Chat Completion (streaming and non-streaming) →
gen_ai.chat - Text Completion (streaming and non-streaming) →
gen_ai.text - Embeddings →
gen_ai.embedding - Speech Generation (streaming and non-streaming) →
gen_ai.speech - Transcription (streaming and non-streaming) →
gen_ai.transcription - Responses API →
gen_ai.responses
Protocol Support
HTTP (OTLP/HTTP)
Uses HTTP/1.1 or HTTP/2 with JSON or Protobuf encoding:gRPC (OTLP/gRPC)
Uses gRPC with Protobuf encoding for lower latency:Metrics Push (Cluster Mode)
Multi-node deployments: If you are running multiple Bifrost nodes, use push-based metrics for accurate aggregation. Pull-based
/metrics scraping may miss nodes behind a load balancer./metrics endpoint (which can miss nodes behind a load balancer), all nodes actively push metrics to a central OTEL Collector.
Configuration
Example Configuration
- HTTP Protocol
- HTTP Protocol (v1.5+)
- gRPC Protocol
- gRPC Protocol (v1.5+)
Pushed Metrics
These are the same Prometheus-style metrics from the telemetry plugin, pushed via OTLP protocol to a central collector:
Note: Size metrics are only recorded when the Content-Length header is present. Requests or responses without it (e.g., chunked transfer encoding, streaming responses) do not produce data points in these histograms.
OTEL Collector Configuration
Configure your OTEL Collector to receive OTLP metrics and export to your preferred backend (Datadog, Prometheus, etc.):Why Push vs Pull?
For single-node deployments, pull-based
/metrics scraping works well. For multi-node clusters, push-based metrics ensures all nodes are captured.
Advanced Features
Automatic Span Management
- Spans are tracked with a 20-minute TTL using an efficient sync.Map implementation
- Automatic cleanup prevents memory leaks for long-running processes
- Handles streaming requests with accumulator for chunked responses
Async Emission
All span emissions happen asynchronously in background goroutines:Streaming Support
The plugin accumulates streaming chunks and emits a single complete span when the stream finishes, providing accurate token counts and costs.Environment Variable Security
Sensitive URLs and credentials never need to appear in stored configuration. Thecollector_url, metrics_endpoint, and header values all accept the env.VAR_NAME format:
env.VAR_NAME reference from the process environment at runtime. Stored configuration (database or config file) retains the env.VAR_NAME string — the resolved value is never persisted. API responses return EnvVar objects with sensitive resolved values redacted.
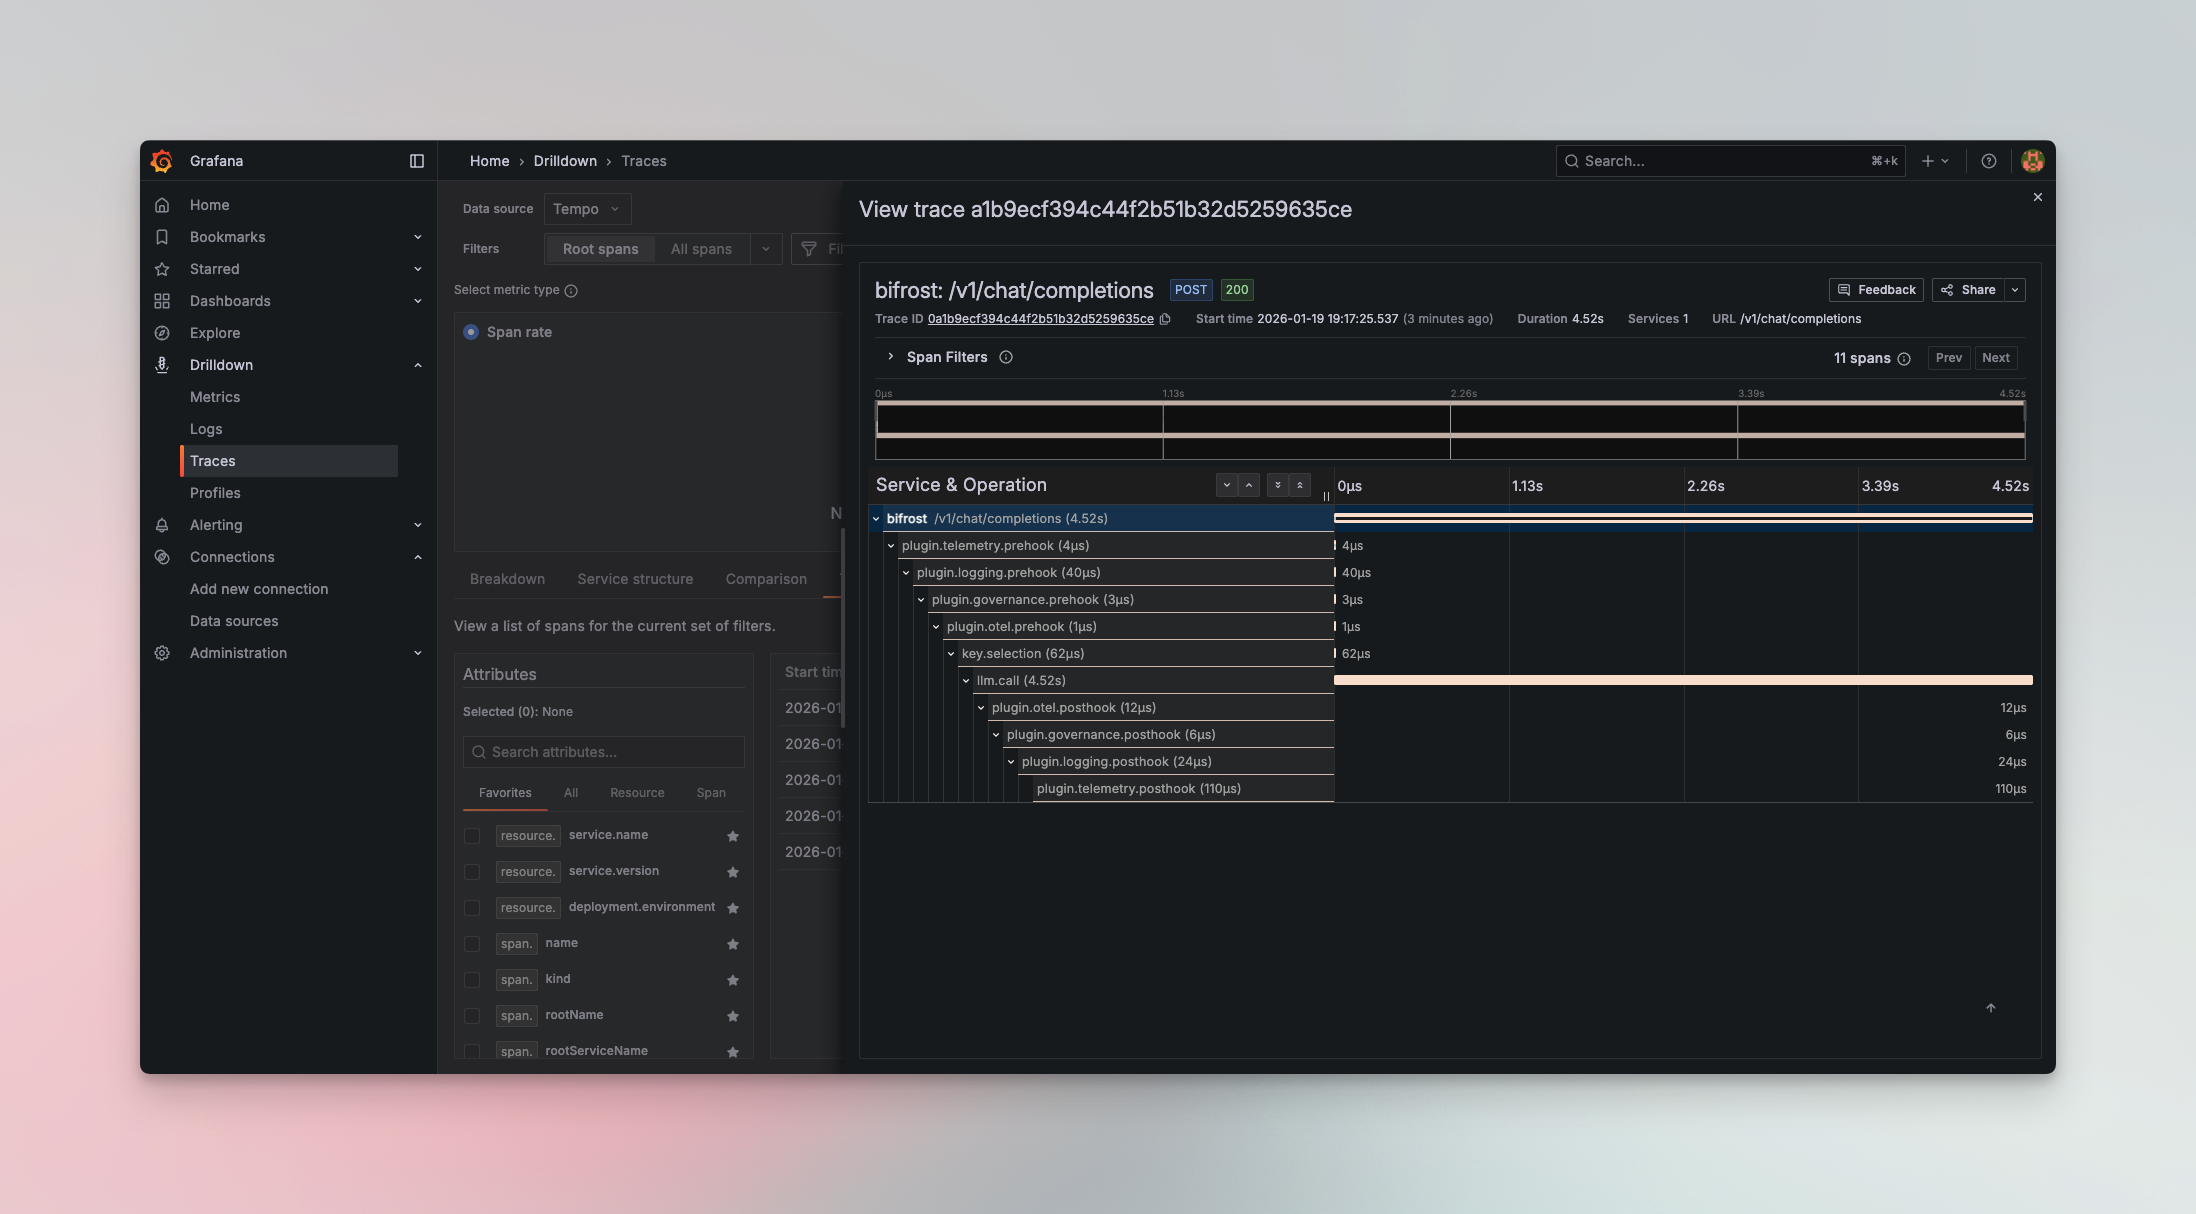
Filtering Plugin Spans
By default every plugin’s pre- and post-hook execution generates a span, which can bloat traces when many plugins are active (e.g. 8 built-in plugins × 2 hooks = 16 plugin spans per request). Useplugin_span_filter inside the OTEL plugin config to control which plugin spans are exported.
Via config.json (inside the OTEL plugin config):
plugin_span_filter is set in config.json with a higher version value.
Filter modes:
Plugin names: list each plugin using the exact name shown for it in the Configure Plugin Tracing sheet — this is the same name that appears in the span (
plugin.<name>.<stage>), and it is what the filter matches against. The built-in OSS plugins are telemetry, prompts, logging, governance, otel, semantic_cache, compat, and maxim. In enterprise deployments some plugins are registered under a different name than their config key — for example the prompts and governance plugins appear as enterprise-prompts and enterprise-governance — so always copy the name from the tracing sheet rather than assuming the config key.
When a plugin span is filtered out, its children are automatically re-parented to the nearest exported ancestor so the trace hierarchy stays connected.
plugin_span_filter follows the standard plugin config precedence rules. To make a config.json value override UI-saved DB settings on restart, set a higher version on the OTEL plugin entry (e.g. "version": 2). See Plugin Versioning for details.When to Use
OTel Plugin
Choose the OTel plugin when you:- Have existing OpenTelemetry infrastructure
- Need to correlate LLM traces with application traces
- Require compliance with enterprise observability standards
- Want vendor flexibility (switch backends without code changes)
- Need multi-service distributed tracing
vs. Built-in Observability
Use Built-in Observability for:- Local development and testing
- Simple self-hosted deployments
- No external dependencies
- Direct database access to logs
vs. Maxim Plugin
Use the Maxim Plugin for:- Advanced LLM evaluation and testing
- Prompt engineering and experimentation
- Team collaboration and governance
- Production monitoring with alerts
- Dataset management and curation
Troubleshooting
Connection Issues
Verify collector is reachable:Missing Traces
Check Bifrost logs for emission errors:Authentication Failures
Verify environment variables are set:Next Steps
- Built-in Observability - Local logging for development
- Maxim Plugin - Advanced LLM evaluation and monitoring
- Telemetry - Prometheus metrics and dashboards