

Overview
The BigQuery plugin stores a structured record of every request that flows through Bifrost in a Google BigQuery table. Each completed trace becomes a single row — provider, model, token usage, cost, latency breakdown, governance attribution, and (optionally) the full conversation — so you can run SQL analytics, build dashboards, and retain history for as long as your BigQuery dataset keeps it. Unlike the OTel and Datadog connectors, which stream spans to a tracing backend, the BigQuery plugin writes a flat, query-optimized table. It is ideal when you want to own the data, join it against your warehouse, or report on cost and usage with plain SQL.The BigQuery plugin is a Bifrost Enterprise feature.
- SQL-native analytics — Query traces directly, or join them against the rest of your warehouse.
- One row per request — A wide, denormalized table that is easy to aggregate, with no span-tree traversal.
- Cost & token attribution — Per-request cost plus fine-grained token breakdowns, attributable to teams, customers, virtual keys, and users.
- Long-term retention — Keep history far beyond what a logs database or APM retention window allows.
- Zero request-latency impact — Traces are buffered and flushed asynchronously in the background.
Authentication
The plugin supports two ways to authenticate with Google Cloud:
The service account (whether from ADC or an explicit key) needs permission to read/write the target table and, if
create_table_if_not_exists is enabled, to create datasets and tables — for example the roles/bigquery.dataEditor role on the dataset (plus roles/bigquery.user on the project for job execution).
Configuration
- Web UI
- config.json
- Open the Observability page in the Bifrost dashboard.
- Select the BigQuery connector.
-
Fill in the configuration fields:
- GCP Project ID — the project that contains your dataset (required).
- Dataset ID and Table ID — defaults are
bifrost_tracesandtraces. - Location — the dataset region (e.g.
US,EU,us-central1). - Authentication Mode — Application Default Credentials (recommended) or Service Account Key.
- Disable Content Logging, Auto-Create Table, Request Headers, Flush Interval, Buffer Size, and Custom Labels as needed.
-
Toggle Enabled on and click Save BigQuery Configuration.
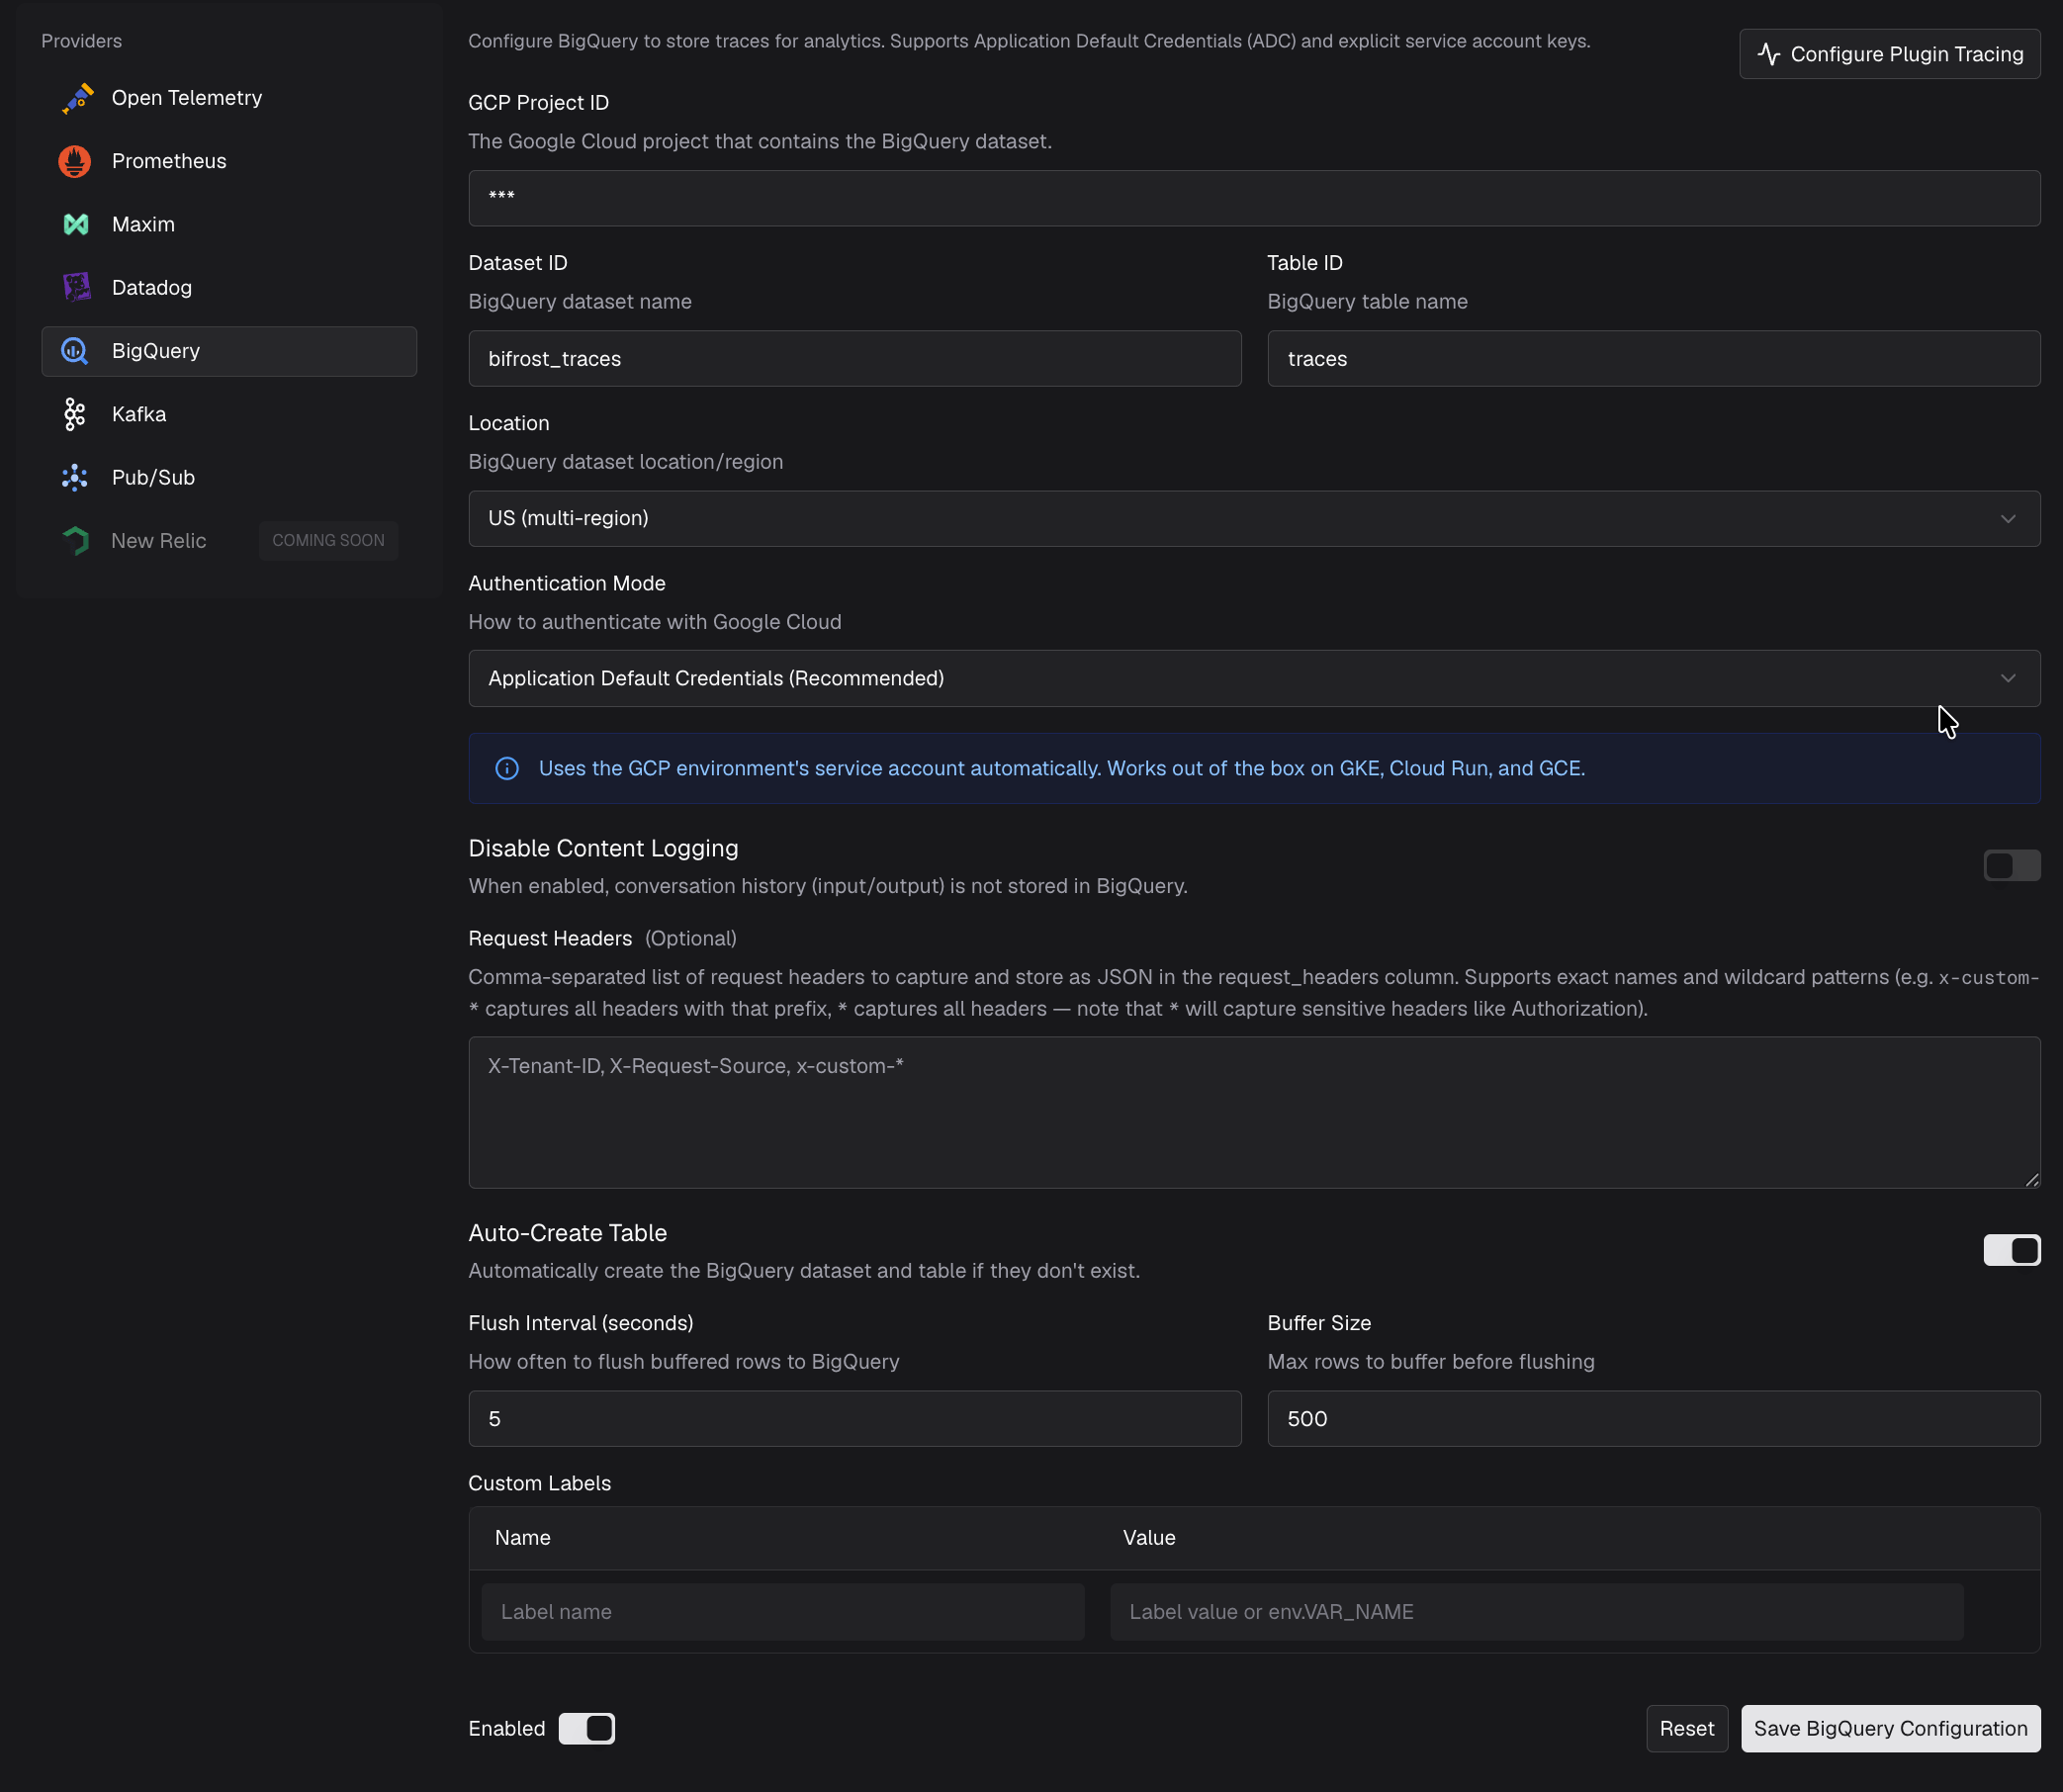
Table Schema
The traces table is partitioned byDATE(timestamp) and clustered by provider, model, virtual_key_id. Partitioning keeps time-range queries cheap (BigQuery prunes partitions), and clustering speeds up filtering by provider, model, or virtual key.
Each row corresponds to one completed trace, including LLM requests and Agent Gateway operations. The columns you will reach for most are timestamp, provider, model, status, latency_ms, total_tokens, and cost, plus the governance columns (team_name, customer_name, virtual_key_name) for attribution. Expand a category below for the full column list.
Core identifiers (10 columns)
Core identifiers (10 columns)
Token usage & cost (4 columns)
Token usage & cost (4 columns)
Token detail breakdowns (15 columns)
Token detail breakdowns (15 columns)
Conversation content — JSON strings (4 columns)
Conversation content — JSON strings (4 columns)
Error info (4 columns)
Error info (4 columns)
Response metadata (6 columns)
Response metadata (6 columns)
Governance attribution (19 columns)
Governance attribution (19 columns)
Routing & retry (2 columns)
Routing & retry (2 columns)
Latency breakdown (5 columns)
Latency breakdown (5 columns)
Session & trace context (3 columns)
Session & trace context (3 columns)
Agent Gateway (4 columns)
Agent Gateway (4 columns)
Custom & bookkeeping (4 columns)
Custom & bookkeeping (4 columns)
CREATE TABLE statement (manual setup)
CREATE TABLE statement (manual setup)
If you prefer to manage the table yourself (with
create_table_if_not_exists set to false), create the dataset and table before enabling the plugin. The UI’s View table schema dialog generates the complete statement for your exact project/dataset/table/location. The outline below shows the structure — expand the accordions above for the full column list:Letting the plugin auto-create the table (the default) guarantees the schema stays in sync as new columns are added across Bifrost releases. If you manage the table manually, you may need to add new columns after an upgrade.
Content & Header Capture
The plugin lets you control how much request detail lands in BigQuery:-
disable_content_logging— Set totrueto omit conversation content. Theinput_historyandoutput_messagecolumns are left empty, while all metadata (tokens, cost, latency, attribution) is still recorded. Use this for privacy-sensitive workloads. -
request_headers— A list of header-name patterns whose values are captured into therequest_headerscolumn as a JSON map. Supports exact names (X-Tenant-ID) and wildcards (x-custom-*, or*for all headers). -
custom_labels— Static key-value pairs attached to every row in thelabelscolumn (JSON). Values supportenv.VAR_NAME, which is handy for environment or region tags. -
dimensions— Per-request dimensions sent viax-bf-dim-*headers are captured automatically into thedimensionscolumn (JSON). No configuration required.
Example Queries
Because each trace is a single row, common analytics are plain SQL aggregations. Replacemy-gcp-project.bifrost_traces.traces with your project, dataset, and table.
Total cost by team over the last 7 days:
Excluding Columns
Some columns are large and not needed downstream.tools is a common example. List the column names you want left unwritten on every row:
tools), not attribute names (gen_ai.request.tools).
The column stays in the table schema and is simply left unwritten, so existing queries and views keep working. A name that does not match any column is ignored. trace_id and timestamp are required and cannot be excluded. The connector rejects a configuration that names either.
An excluded column is written as
NULL, not as an empty string. Filter it with WHERE error_message IS NULL — WHERE error_message = '' will not match.plugin_pre_latency_ms and plugin_post_latency_ms columns.
Plugin Span Filtering
By default every plugin’s pre- and post-hook execution contributes its latency to the stored row. Useplugin_span_filter inside the BigQuery plugin config to control which plugin spans count toward the flattened latency columns (plugin_pre_latency_ms / plugin_post_latency_ms). It selects whole spans by plugin name. To leave a column empty, see Excluding Columns.
Via config.json (inside the BigQuery plugin config):
Plugin names: list each plugin using the exact name shown in the Configure Plugin Tracing sheet. Note that some plugins are registered under a different name than their config key — for example the enterprise prompts and governance plugins appear as
enterprise-prompts and enterprise-governance. Common names include telemetry, logging, otel, semantic_cache, compat, maxim, enterprise-prompts, enterprise-governance, datadog, bigquery, and guardrails.
Unlike the OTEL and Datadog connectors, BigQuery has no span tree — a filtered plugin span’s latency is simply omitted from the flattened row, and no re-parenting occurs. Each observability connector has its own independent
plugin_span_filter. It follows the standard plugin config precedence rules; to make a config.json value override UI-saved DB settings on restart, set source_of_truth: "config.json". See Source of Truth & Reconciliation for details.Agent Gateway
A2A traces use the same table and writer as LLM traces. Each completed trace becomes a row, with the A2A operation name inrequest_type and the following additional nullable STRING columns:
Existing columns hold
trace_id, request_id, session_id, status, errors, latency, and governance attribution. stream identifies streaming and subscription operations. Structured request content goes into input_history; response content, including returned tasks, artifacts, and accumulated streaming output, goes into output_message. A streaming operation produces a completed row rather than one row per stream event.
disable_content_logging and virtual-key content suppression omit message content. excluded_attributes can exclude columns from the row. Raw HTTP payloads require Agent Gateway raw capture plus export_raw_payloads; gRPC has structured content but no raw HTTP capture.
With create_table_if_not_exists enabled, startup appends missing columns to an existing table while preserving its rows. For manually managed tables, add these four nullable columns before enabling the updated connector. The UI’s View table schema dialog provides the full current schema.
Troubleshooting
Table or dataset not found
Symptom: Errors about a missing dataset or table on startup. Cause:create_table_if_not_exists is false and the table does not exist, or the service account lacks create permissions.
Fix: Either enable auto-creation, or run the CREATE TABLE statement manually and grant the service account roles/bigquery.dataEditor.
Authentication failures
Symptom:failed to create BigQuery client errors at startup.
Cause: ADC is not available in the environment, or service_account_key is set but empty/invalid.
Fix: On GCP, confirm the workload’s service account is attached. Off GCP, set service_account_key to an env.VAR_NAME whose value is the unescaped service account JSON, and verify the variable is populated:
No rows appearing
Symptom: The plugin is enabled but the table stays empty. Cause: Rows are written in batches, so very low traffic can delay the first write. The service account may also lack write permission. Fix: Send some traffic and wait at leastflush_interval_seconds, then confirm the service account has roles/bigquery.dataEditor on the dataset. Enable debug logging to surface any write errors:
Missing conversation content
Symptom:input_history and output_message are empty.
Cause: disable_content_logging is true.
Fix: Set it to false if you want conversation content stored.
Next Steps
- OpenTelemetry (OTel) — Stream traces to any OTLP-compatible backend.
- Datadog — Native Datadog APM and LLM Observability integration.
- Built-in Observability — Local logging for development and simple deployments.
- Telemetry — Prometheus metrics and dashboards.